One-factor Measures of Interest-Rate Risk for an Option-Free Fixed Coupon Bond
Roberto Bastianic, 30 Jul 2017 The interest rate risk of a bond may be measured by how much its price changes as interest rates change. The change in the price of a fixed-rate coupon bond when market interest rates change is due to the fact that the bond’s coupon rate differs from the prevailing market interest rate. When a bond’s coupon is higher than the market interest-rate the demand for the bond will increase which will drive its price up. Inversely, when the coupon is lower than the market interest-rate, investors will favor newly issued bonds paying higher coupons which will drive the price down.
The price sensitivity measure is used by traders hedging a position in one bond with another bond or with a future. Hedging a bond position with futures contracts is much more efficient as capital requirements are considerably lower for this type of trade. Traders wishing to hedge a bond position must be able to compute how the bond position and the futures contract respond to changes in rates. This post will focus on measuring interest rate risk of option-free fixed-coupon bonds, those without an embedded call or put option and paying a fixed coupon over their lifetime.
The example bond used throughout the various sensitivity computations shall be the Federal Republic of Germany debt security maturing on the 4th of January 2020 and paying an annual coupon of 3.25%.
The pricing parameters of the bond are as follows:
| Name | Value |
|---|---|
| Maturity | 04-Jan-20 |
| Coupon Rate | 3.25% |
| Coupon frequency | 1 |
| Valuation date | 18-Nov-16 |
| Day count convention | Actual/Actual |
| Previous coupon payment date | 04-Jan-16 |
| Next coupon payment date | 04-Jan-17 |
| Price (P’) | 95.1843 |
| Yield (y’) | 6% |
Table 1
First Derivative of Price with Respect to Yield
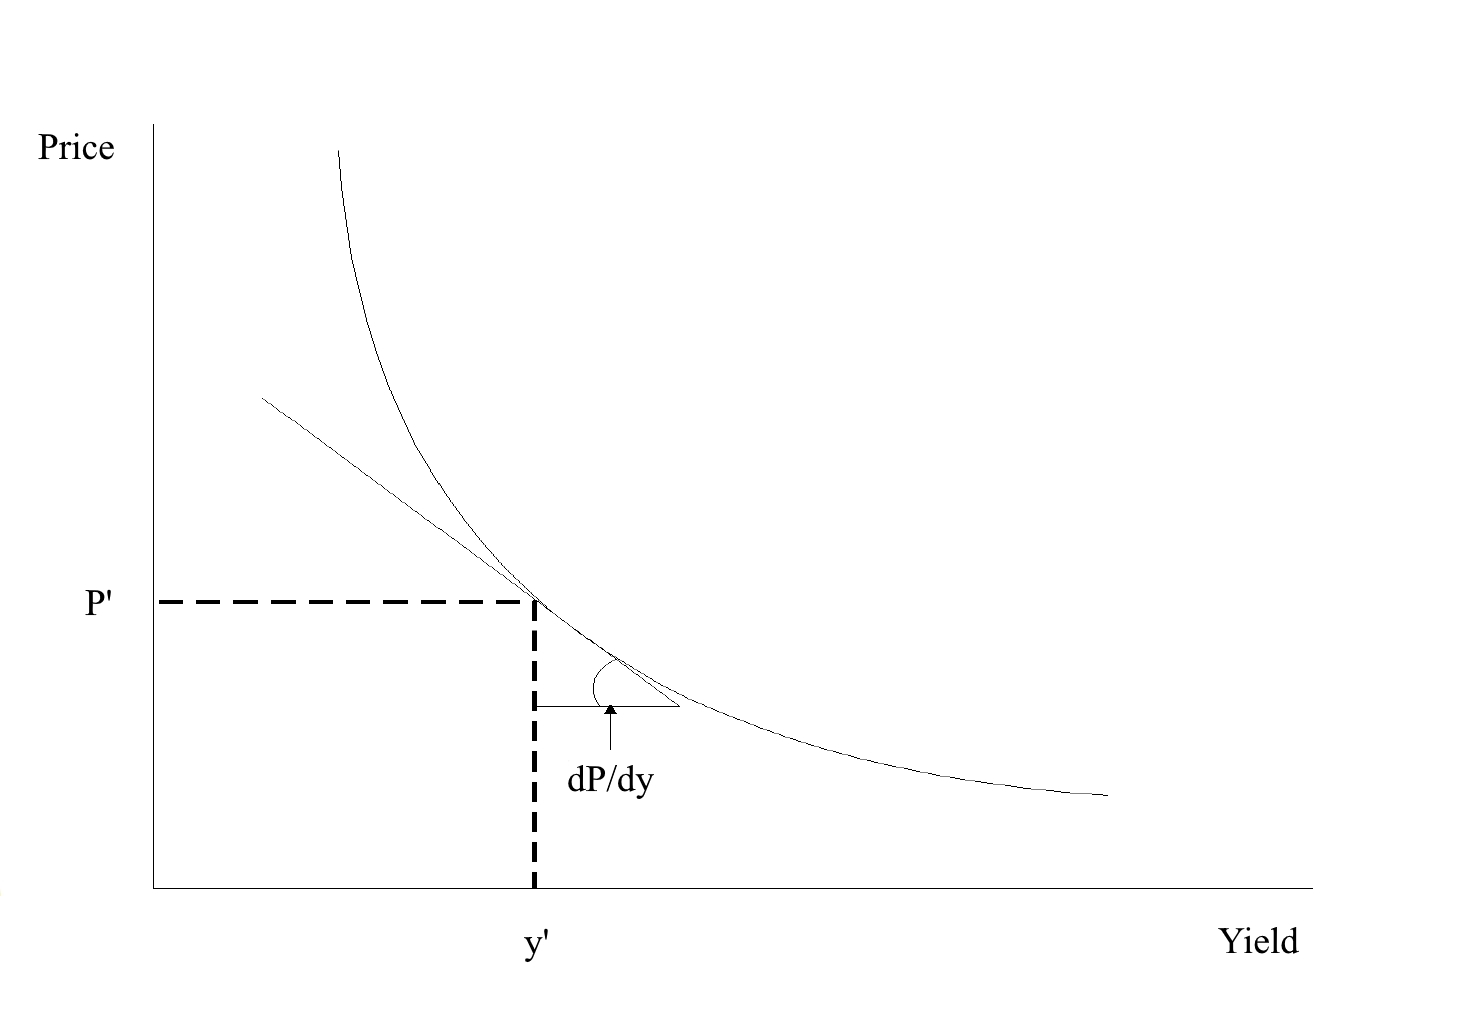
The first derivative of price with respect to yield represents the number of basis points change in price per 1bp (0.01%) parallel shift in yields. The one rate that discounts all cash
flows is perturbed. The first derivative of price with respect to yield is the slope of the tangent line of the price/yield curve.
Given the price/yield function of the above bond
\[P = \frac{3.25}{(1 + y)^{0.1284153005}} + \frac{3.25}{(1 + y)^{1.1284153005}}+\frac{3.25}{(1 + y)^{2.1284153005}}+\frac{103.25}{(1 + y)^{3.1284153005}}\]
The first derivative of price with respect to yield is
\[\frac{dP}{dy}=\frac{-0.41735}{(y + 1)^{1.12842}} - \frac{3.66735}{(y + 1)^{2.1284153005}} - \frac{6.91735}{(y + 1)^{3.1284153005}} - \frac{323.009}{(y + 1)^{4.1284153005}}\tag{1}\]
Substituting \(y\) with y’ gives
\[\frac{dP}{dy}=-263.34\ bp\]
The first derivative can also be estimated
\[\frac{dP}{dy}=\frac{P(Y+ΔY)- P(Y-ΔY)}{2ΔY}\tag{2}\]
where ΔY > 0
In the following table approximate first derivative values are computed for increasing yield changes. Note that the value is approximately the same for small ΔY. Financial providers prefer the approximation formula over the exact one because it requires less computing power.
| Yield change (ΔY) | New yield | New price | \[\approx\frac{dP}{dy}\] |
|---|---|---|---|
| +20 bp | 6.20% | 94.6597 | -263.3 bp |
| -20 bp | 5.80% | 95.7130 | -263.3 bp |
| +100 bp | 7.00% | 92.6008 | -263.4 bp |
| -100 bp | 5.00% | 97.8692 | -263.4 bp |
| +200 bp | 8.00% | 90.1138 | -263.7 bp |
| -200 bp | 4.00% | 100.6604 | -263.7 bp |
| +500 bp | 11.00% | 83.1889 | -265.4 bp |
| -500 bp | 1.00% | 109.7269 | -265.4 bp |
| +1000 bp | 16.00% | 73.2063 | -271.6 bp |
| -1000 bp | -4.00% | 127.5302 | -271.6 bp |
Table 2
A common ambuiguity about the Eq. (2) is the consistency between the yield change that is used to compute the first derivative and the interpretation of the first derivative. For example, in row 1 and 2 of the above table we used a 20 basis point yield change to obtain the two prices to use in the numerator of Eq. (2). Yet we interpret the first derivative as the approximate price change for a 1 basis point change in yield. The reason is that regardless of the yield change used to estimate the first derivative in Eq. (2), the interpretation is the same. If we used a 200 basis point change in yield to compute the prices used in the numerator of Eq. (2), the result is interpreted as the approximate price change for a 1 basis point change in yield.
PVBP
The Price Value of a Basis Point is the approximate change in price per 100 currency units of face value per 1 bp = 0.01% = 0.0001 change in yield. It is computed by dividing the first derivative of price with respect to yield by 10,000 in order to shift from basis points to currency units of face value.
\[PVBP=-\frac{1}{10,000}\frac{dP}{dy}\tag{3}\]
As the sensitivity is always negative due to the price/yield relationship it is market convention to display it as a positive figure. That is the reason of the minus sign in the PVBP formula.
For our example bond the PVBP is
\[PVBP=-\frac{-263.34}{10,000}=€0.0263\]
In words, with yield at 6% the price of the bond falls by about 2.63 cents for a one-basis point rise in yield for 100 currency units of face value. For a position of €100 million face value the interest rate risk is
\[€100,000,000\times\frac{0.0263}{100}=€26,300\]
Modified Duration
Modified duration represents an approximate percentage change in full price per 100 bp (1%) change in yield.
\[D_{Mod}=-\frac{1}{P}\frac{dP}{dy}\tag{4}\]
By substituting the above values we obtain
\[D_{Mod}=-\frac{1}{95.1843}\times-263.34=2.77\]
A duration of 2.77 means that the approximate change in price for this bond is 2.77% for a 100 basis point change in yield.
The duration of a bond can also be computed as follows:
\[D_{Mod}=\frac{P(Y-ΔY)-P(Y+ΔY)}{2P(Y)ΔY}\tag{5}\]
For example, using the prices for a 20 bp change from Table 2
\[D_{Mod}=\frac{95.7130-94.6597}{2\times95.1843\times0.002}=2.77\]
##Approximating the Percentage Price Change Using Duration
The following formula is used to approximate the percentage price change for a given change in yield and a given duration:
\[Approximate\ percentage\ price\ change = −D_{Mod}\timesΔY\times100\tag{6}\]
The reason for the negative sign on the right-hand side of Eq. (6) is due to the inverse relationship between price change and yield change.
For our example bond, whose modified duration we just showed is 2.77 the approximate percentage price change for a 20 bp increase in yield is
\[Approximate\ percentage\ price\ change = −2.77\times0.002\times100=-0.55\]
The actual percentage change is (94.6597 is the new price for a 6.20% yield)
\[\frac{95.1843-94.6597}{95.1843\times100}=-0.55\]
The estimate is quite accurate for a small change in yield. However, using a large yield change of 500 bp the accuracy will drop significantly as it can be observed from the following:
\[D_{Mod}=\frac{109.7269 - 83.1889}{2\times95.1843\times0.002}=2.788\]
\[Approximate\ percentage\ price\ change = −2.788\times0.05\times100=-13.94\]
\[Actual\ percentage\ price\ change=\frac{95.1843-83.1889}{95.1843\times100}=-12.60\]
The difference between the estimate and the actual value is quite substantial for a 500 bp increase in yield. The difference is graphically depicted in the below illustration.
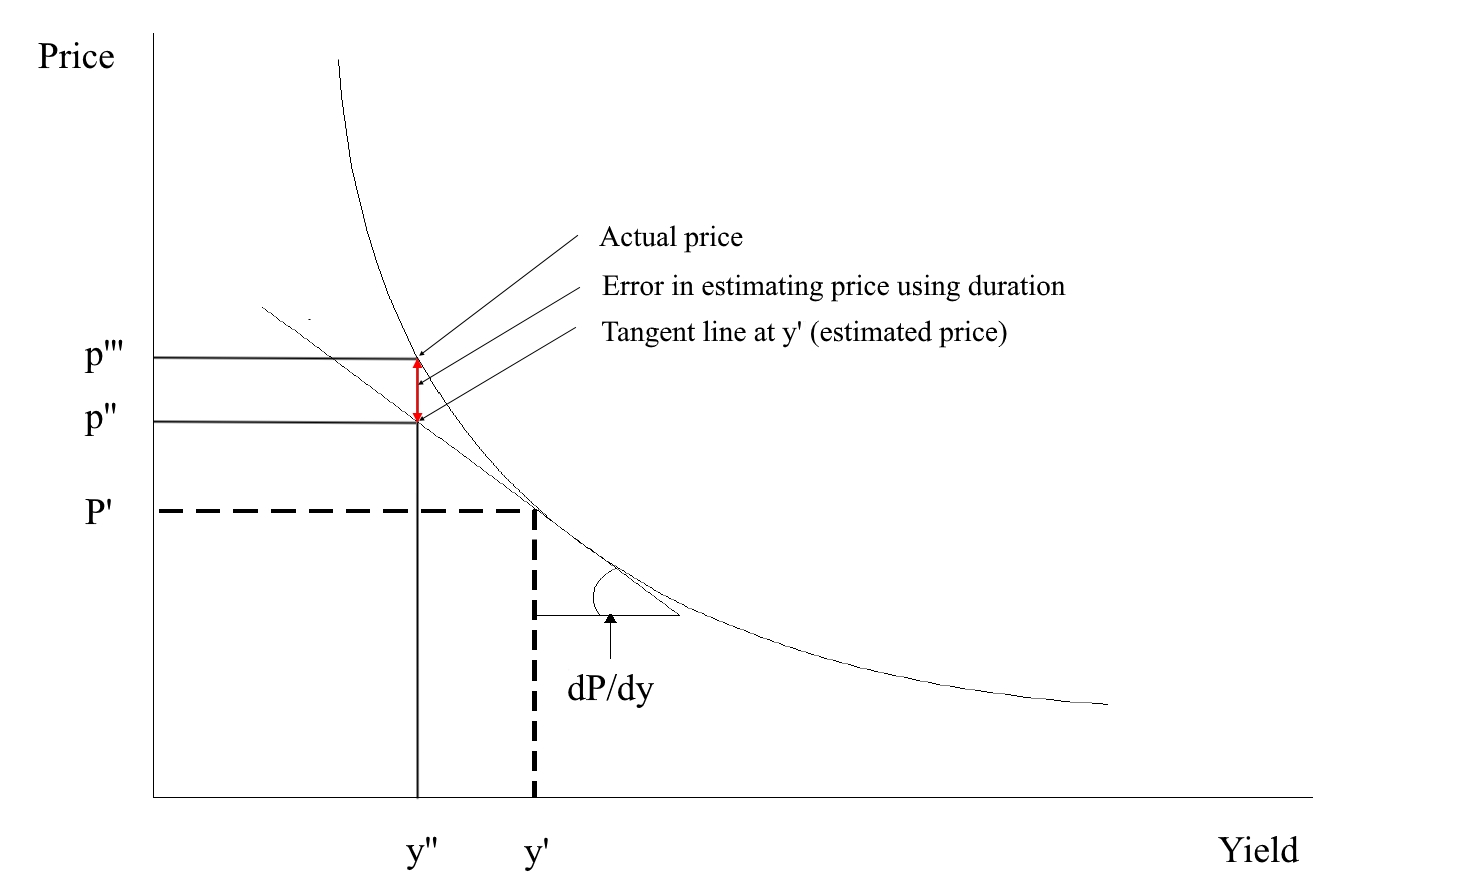
The above illustration helps us to understand why modified duration did an effective job of estimating the percentage price change or, equivalently, the new price when the yield changes by a small number of basis points. For a small change in yield, the tangent line does not depart much from the price/yield curve. Hence, when the yield changes up or down by 20 basis points, the tangent line does a good job of estimating the new price. The error in the estimate gets larger the further one moves from the initial yield. The estimate is less accurate the more convex the bond. For large changes in yield the approximation can be improved by using a second measure referred to as convexity measure.
Convexity measure
Convexity measure is approximated using the following formula:
\[Convexity\ measure=\frac{P(Y+ΔY) +P(Y-ΔY) – 2P(Y)}{2P(Y)(ΔY)^2}\]
Using the values from Table 2, for a 500 basis points change we obtain`
\[Convexity\ measure=\frac{83.1889 + 109.7269 - 2\times95.1843}{2\times95.1843\times(0.05)^2}=5.35\]
Convexity adjustment
Given the convexity measure, the approximate percentage price change adjustment due to the bond’s convexity (i.e., the percentage price change not explained by duration) is
\[Convexity\ Adjustment=Convexity\ Measure \times (ΔY)^2 \times 100\]
Subsituting the values for our example bond and for 500 basis points yield change
\[Convexity\ Adjustment=5.35 \times (0.05)^2 \times 100=1.34\]
If the yield increases from 6% to 11%, the convexity adjustment to the approximate percentage price change based on duration would be 1.34%. The approximate percentage price change based on duration and the convexity adjustment is found by adding the two estimates. Thus, for example, if yields change from 6% to 11%, the estimated percentage price change would be
Estimated change using duration = -13.94%
Convexity adjustment + 1.34%
Total estimated percentage price change = -12.60%
The actual percentage price change is −12.60%.
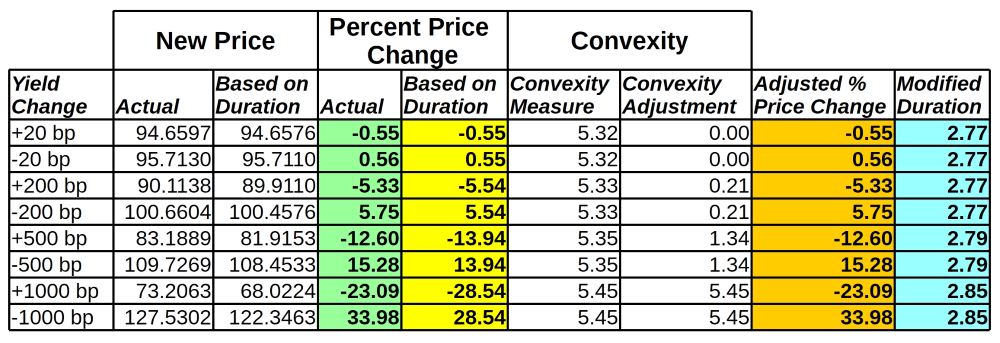
The below table summarizes the actual and estimated percentage price change for various yield shifts.